Ribbon Research · 2025 edition
2025 Federal Incorporation Statistics
 Nicholas Wesley-JamesCEO, Ribbon Business
An analysis of 85,289 federal corporations incorporated in 2025: registered-office locations, directors per corporation, recorded director addresses outside Canada, company names and the most popular incorporation dates.
Federal incorporation records offer a view of how Canadian corporations are organized. This dataset is concentrated in  Ontario, most corporations list a single director, and a small share of director addresses are outside Canada. Incorporation dates also reveal a weekday pattern: Wednesday has the highest annual total, while Tuesday leads on average per occurrence.
These figures cover federal corporations incorporated in 2025 in our dataset. Directors, names and addresses reflect the August 2026 collection snapshot.
85,289 corporations incorporated under the Canada Business Corporations Act (CBCA) in 2025, analyzed using collected registry data. Addresses, directors and names reflect the August 2026 collection snapshot. Provincial incorporations are excluded. These counts are not an official total of all Canadian or federal incorporations.
Read the methodology and limitationsWhere the corporations were registered
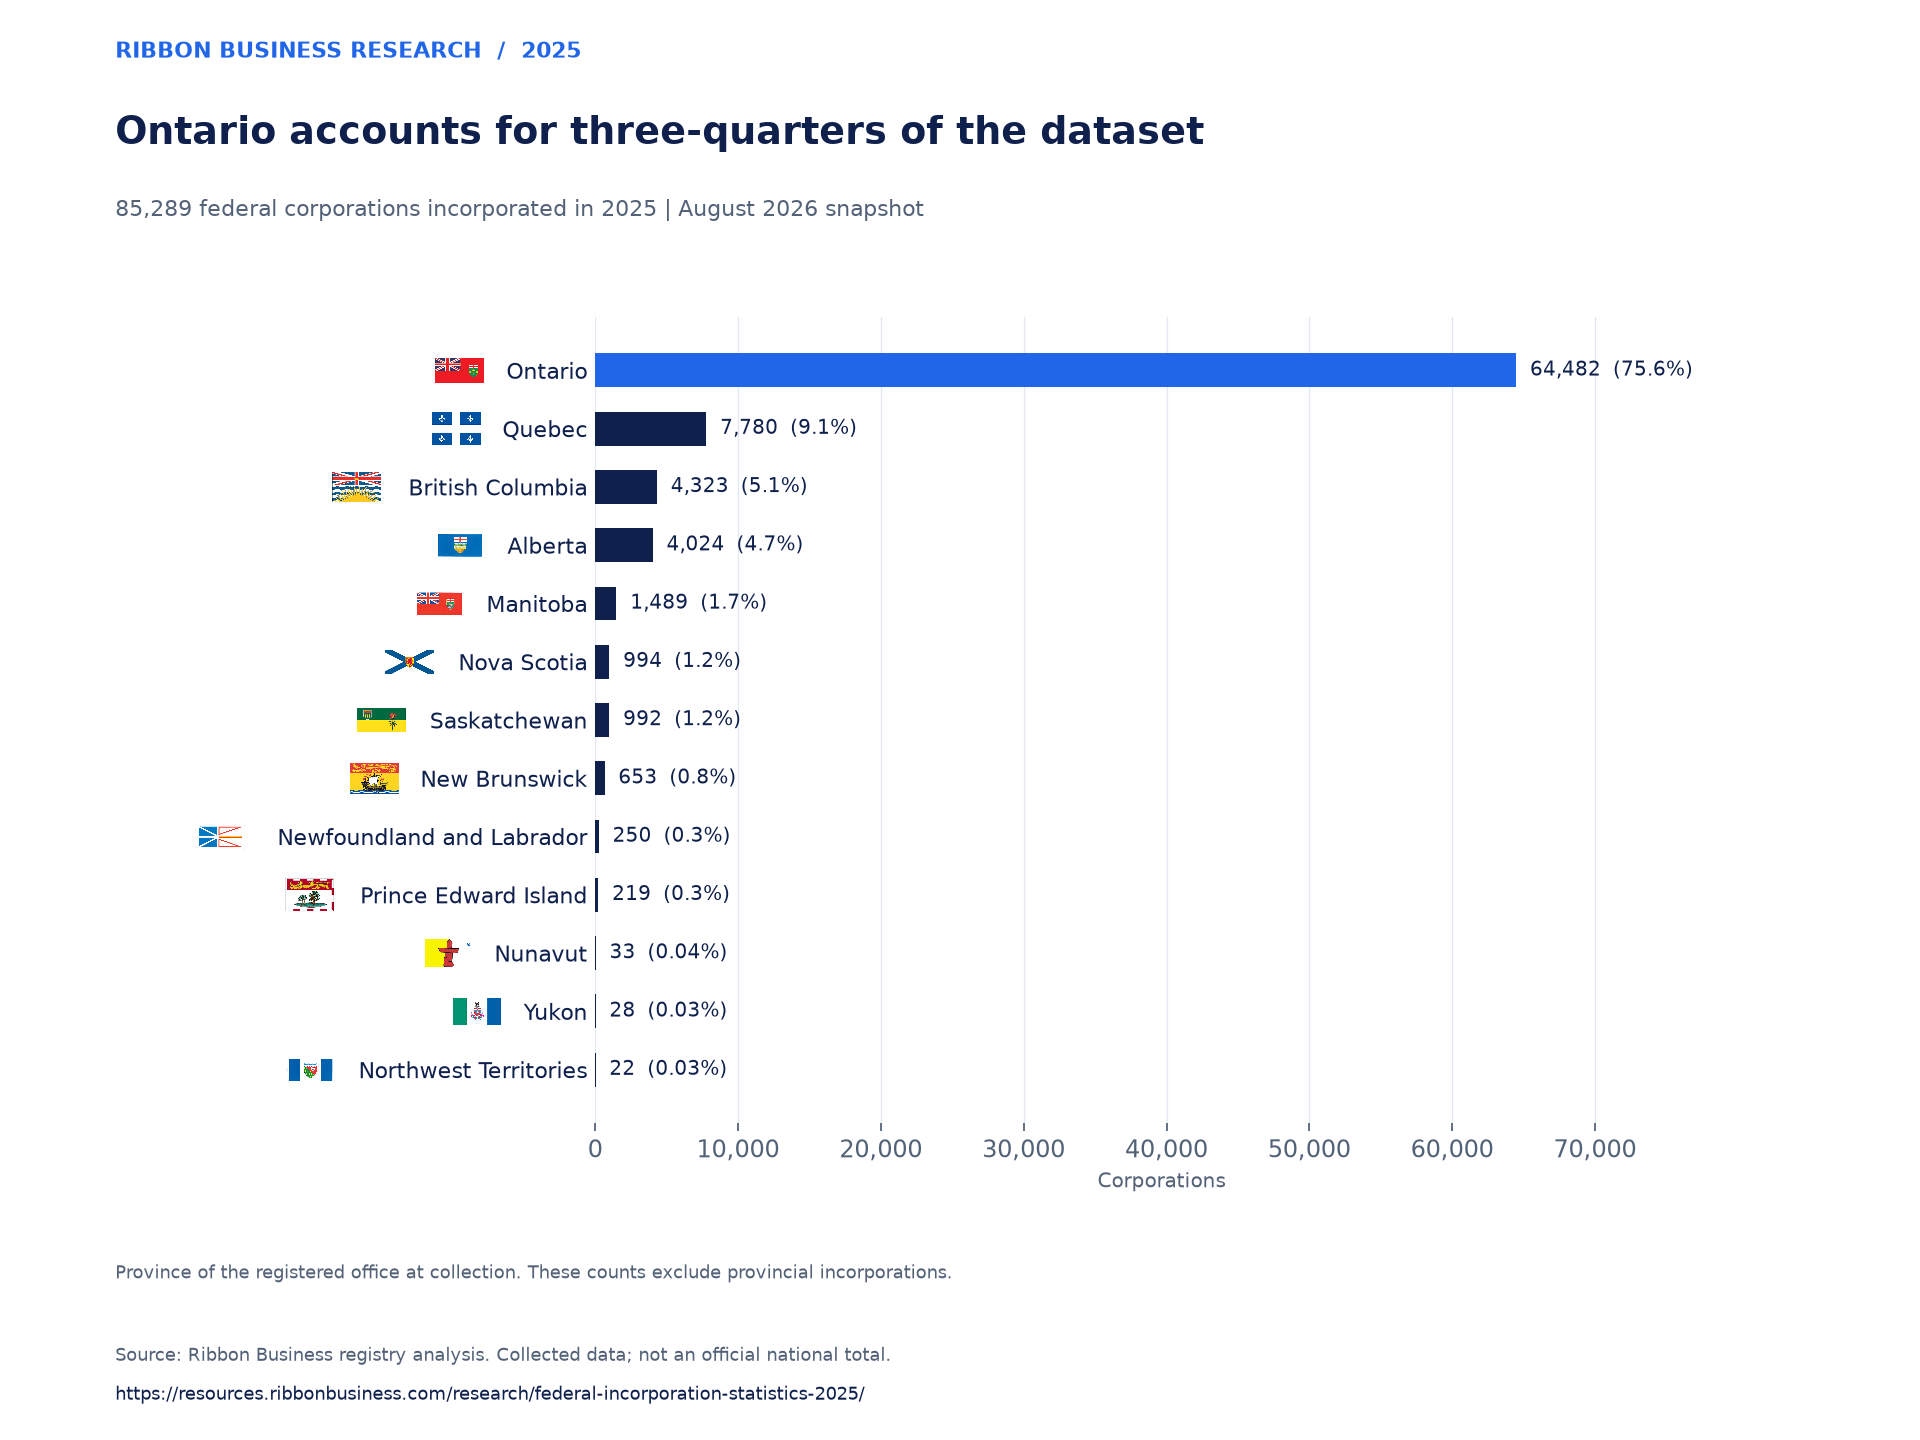
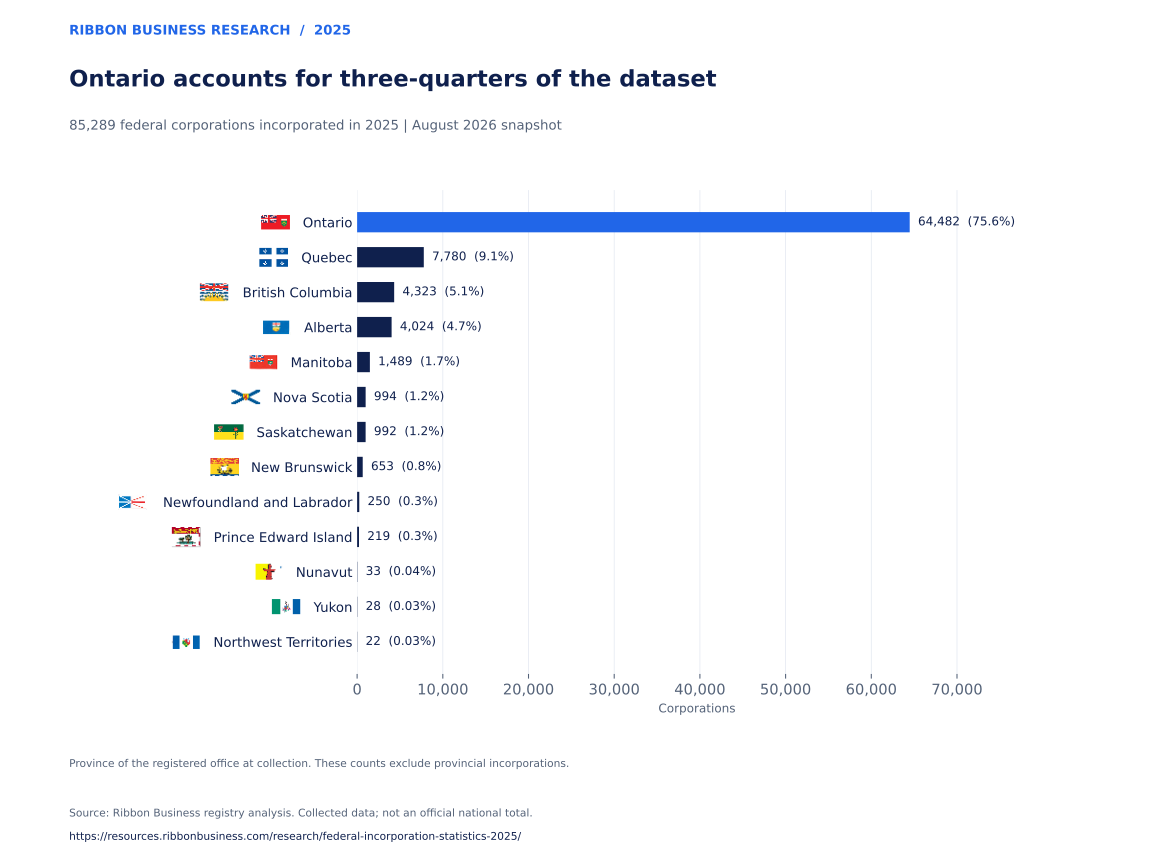
64,482 corporations (75.6%) had a registered office in Ontario at collection.  Quebec followed with 7,780,
  British Columbia with 4,323, and
  Alberta with 4,024.
This distribution describes the federal corporations in our dataset. It does not measure all new businesses in each province, or the proportion of a province's businesses that choose federal incorporation. Provincial corporations and unincorporated businesses are outside the population.
2025 federal incorporation dataset · 85,289 corporations
- Ontario64,482 75.6%
- Quebec7,780 9.1%
- British Columbia4,323 5.1%
- Alberta4,024 4.7%
 Manitoba1,489 1.7%
 Nova Scotia994 1.2%
 Saskatchewan992 1.2%
 New Brunswick653 0.8%
 Newfoundland and Labrador250 0.3%
 Prince Edward Island219 0.3%
 Nunavut33 0.04%
 Yukon28 0.03%
 Northwest Territories22 0.03%
Province of the registered office at collection. These counts exclude provincial incorporations.
Source: Ribbon Business registry analysis · Collected August 2026
View data table: province or territory
| Province or territory | Corporations | Percentage |
|---|---|---|
| Ontario | 64,482 | 75.6% |
| Quebec | 7,780 | 9.1% |
| British Columbia | 4,323 | 5.1% |
| Alberta | 4,024 | 4.7% |
| Manitoba | 1,489 | 1.7% |
| Nova Scotia | 994 | 1.2% |
| Saskatchewan | 992 | 1.2% |
| New Brunswick | 653 | 0.8% |
| Newfoundland and Labrador | 250 | 0.3% |
| Prince Edward Island | 219 | 0.3% |
| Nunavut | 33 | 0.04% |
| Yukon | 28 | 0.03% |
| Northwest Territories | 22 | 0.03% |
One city stands out: Brampton accounts for 10,870 corporations (12.7%) in the dataset. Our separate Brampton study examines its city comparison, postal areas and registered-office address patterns.
For founders comparing the two incorporation routes, our Ontario incorporation guide explains the practical differences between provincial and federal incorporation.
How many directors does each corporation have?
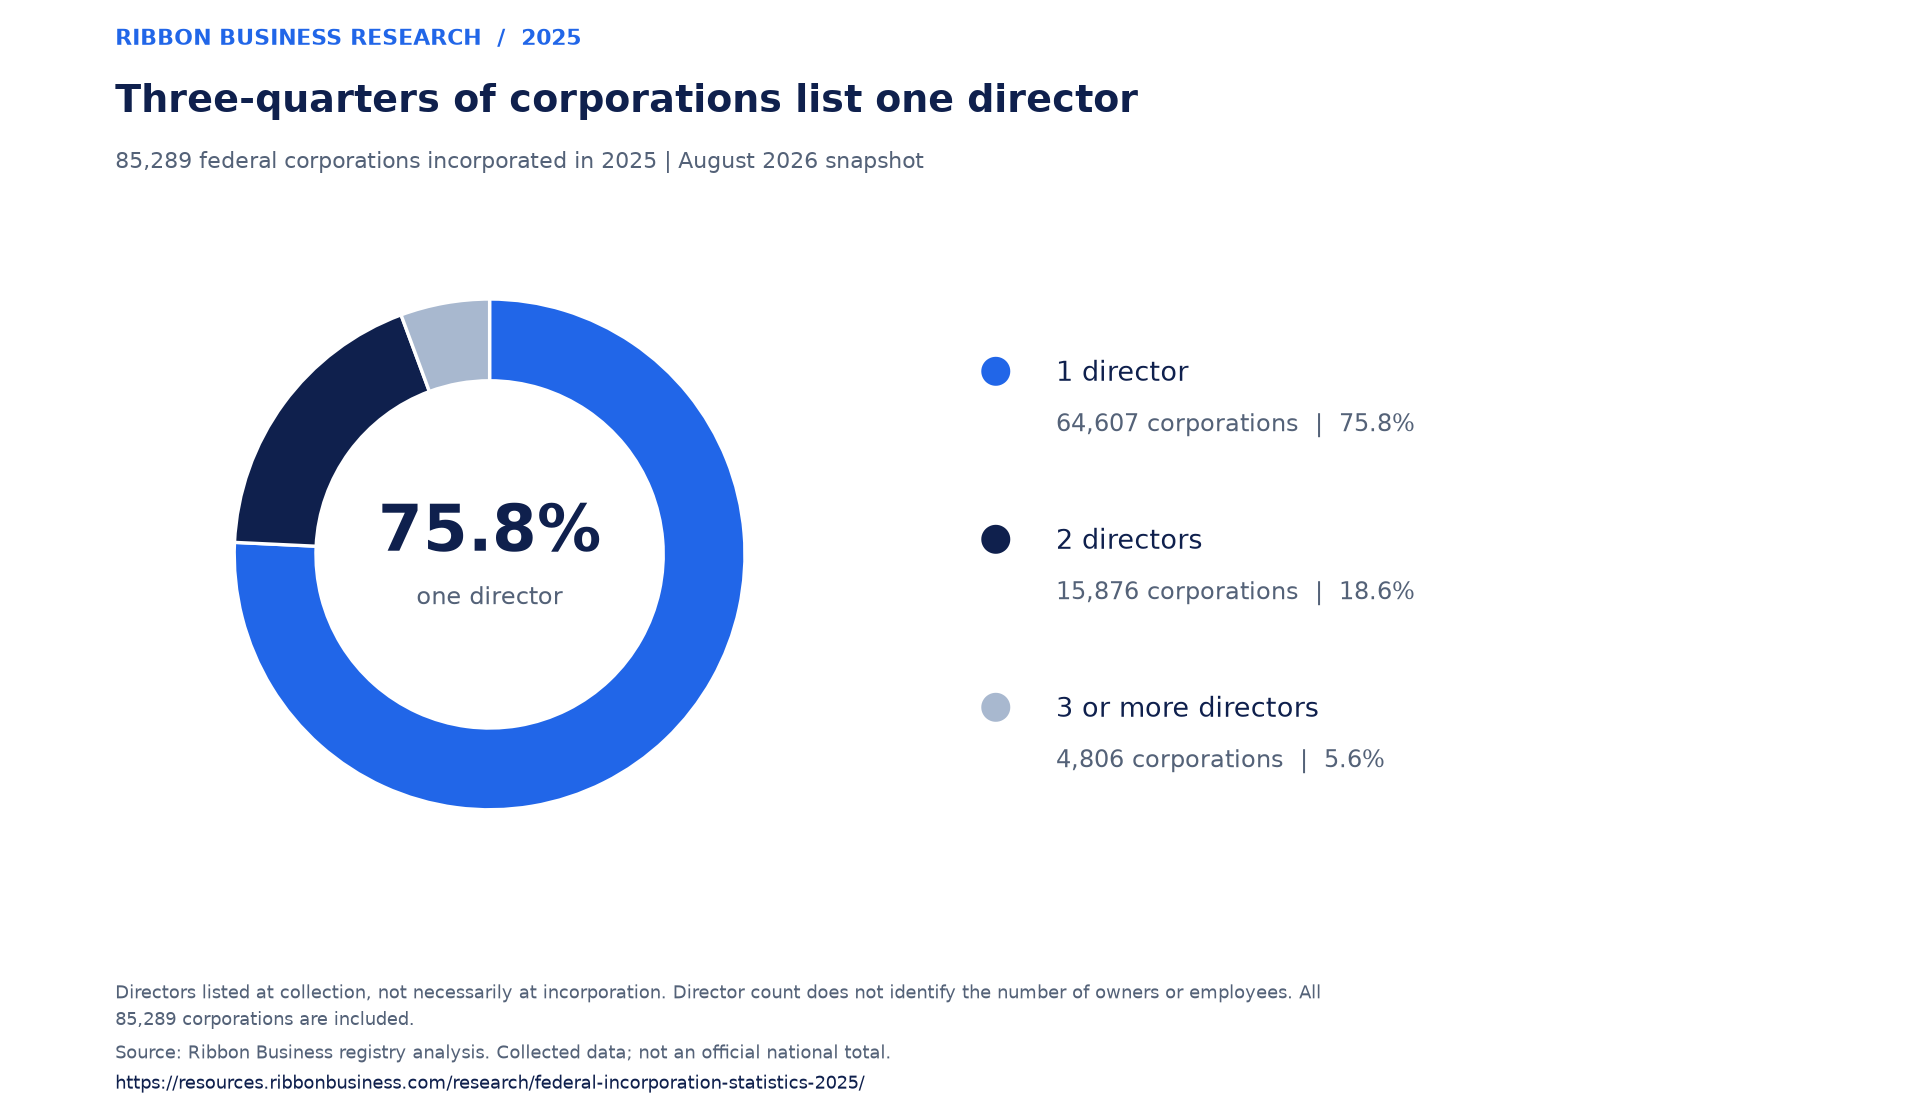
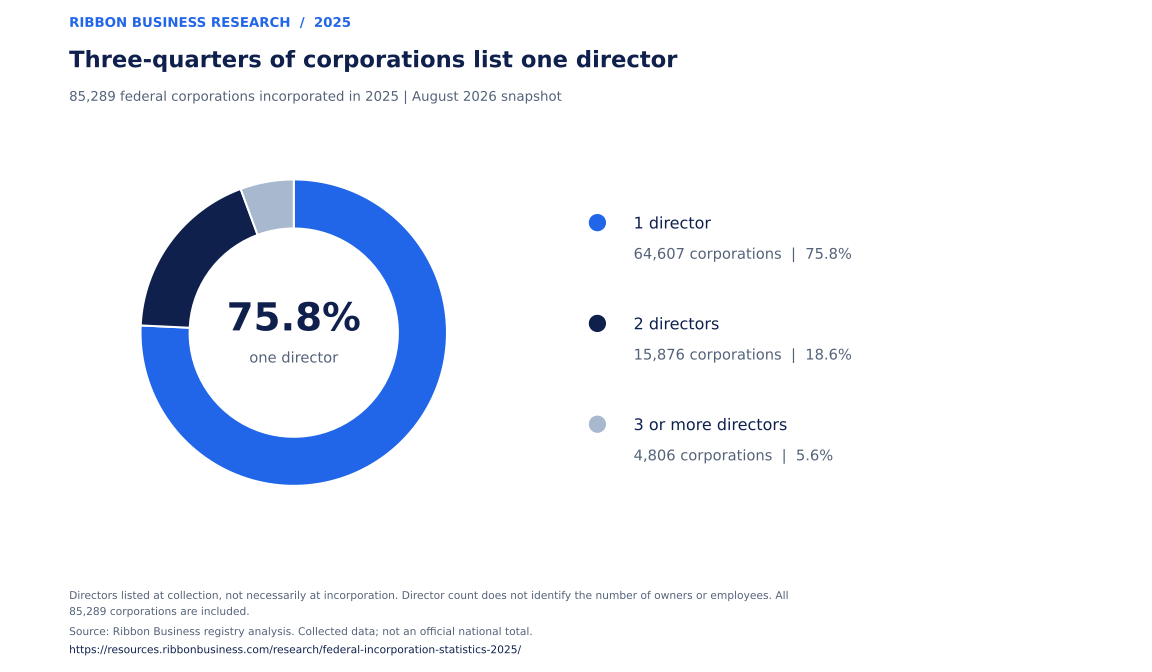
64,607 corporations (75.75%) listed one director at collection. Another 15,876 (18.61%) listed two. Together, corporations with one or two directors account for 94.4% of the dataset.
Across the 85,289 corporations, there are 113,034 director records, an average of 1.33 per corporation. The largest board recorded has 15 directors.
2025 federal incorporation dataset · 85,289 corporations
- 1 director64,607 75.8%
- 2 directors15,876 18.6%
- 3 or more directors4,806 5.6%
Directors listed at collection, not necessarily at incorporation. Director count does not identify the number of owners or employees. All 85,289 corporations are included.
Source: Ribbon Business registry analysis · Collected August 2026
View data table: directors per corporation
| Directors per corporation | Corporations | Percentage |
|---|---|---|
| 1 director | 64,607 | 75.8% |
| 2 directors | 15,876 | 18.6% |
| 3 directors | 3,313 | 3.9% |
| 4 directors | 1,062 | 1.2% |
| 5 directors | 263 | 0.3% |
| 6 directors | 86 | 0.1% |
| 7 directors | 49 | 0.06% |
| 8 directors | 13 | 0.02% |
| 9 directors | 6 | <0.01% |
| 10 directors | 9 | 0.01% |
| 11 directors | 1 | <0.01% |
| 12 directors | 1 | <0.01% |
| 13 directors | 0 | 0.0% |
| 14 directors | 2 | <0.01% |
| 15 directors | 1 | <0.01% |
The donut groups corporations into one, two, or three or more directors. The data table and CSV retain the complete breakdown from one to 15 directors. Thirteen directors is shown as zero because none of the corporations has that board size in the stored records. Two corporations have 14 directors and one has 15; these three records were omitted from the initial summary table and have now been restored from the database.
A director count describes a board, not the number of owners, founders or employees. The same individual may also be a director of several corporations, so the total is a count of director records rather than distinct people. For the practical roles, see officers and directors.
Recorded director addresses outside Canada
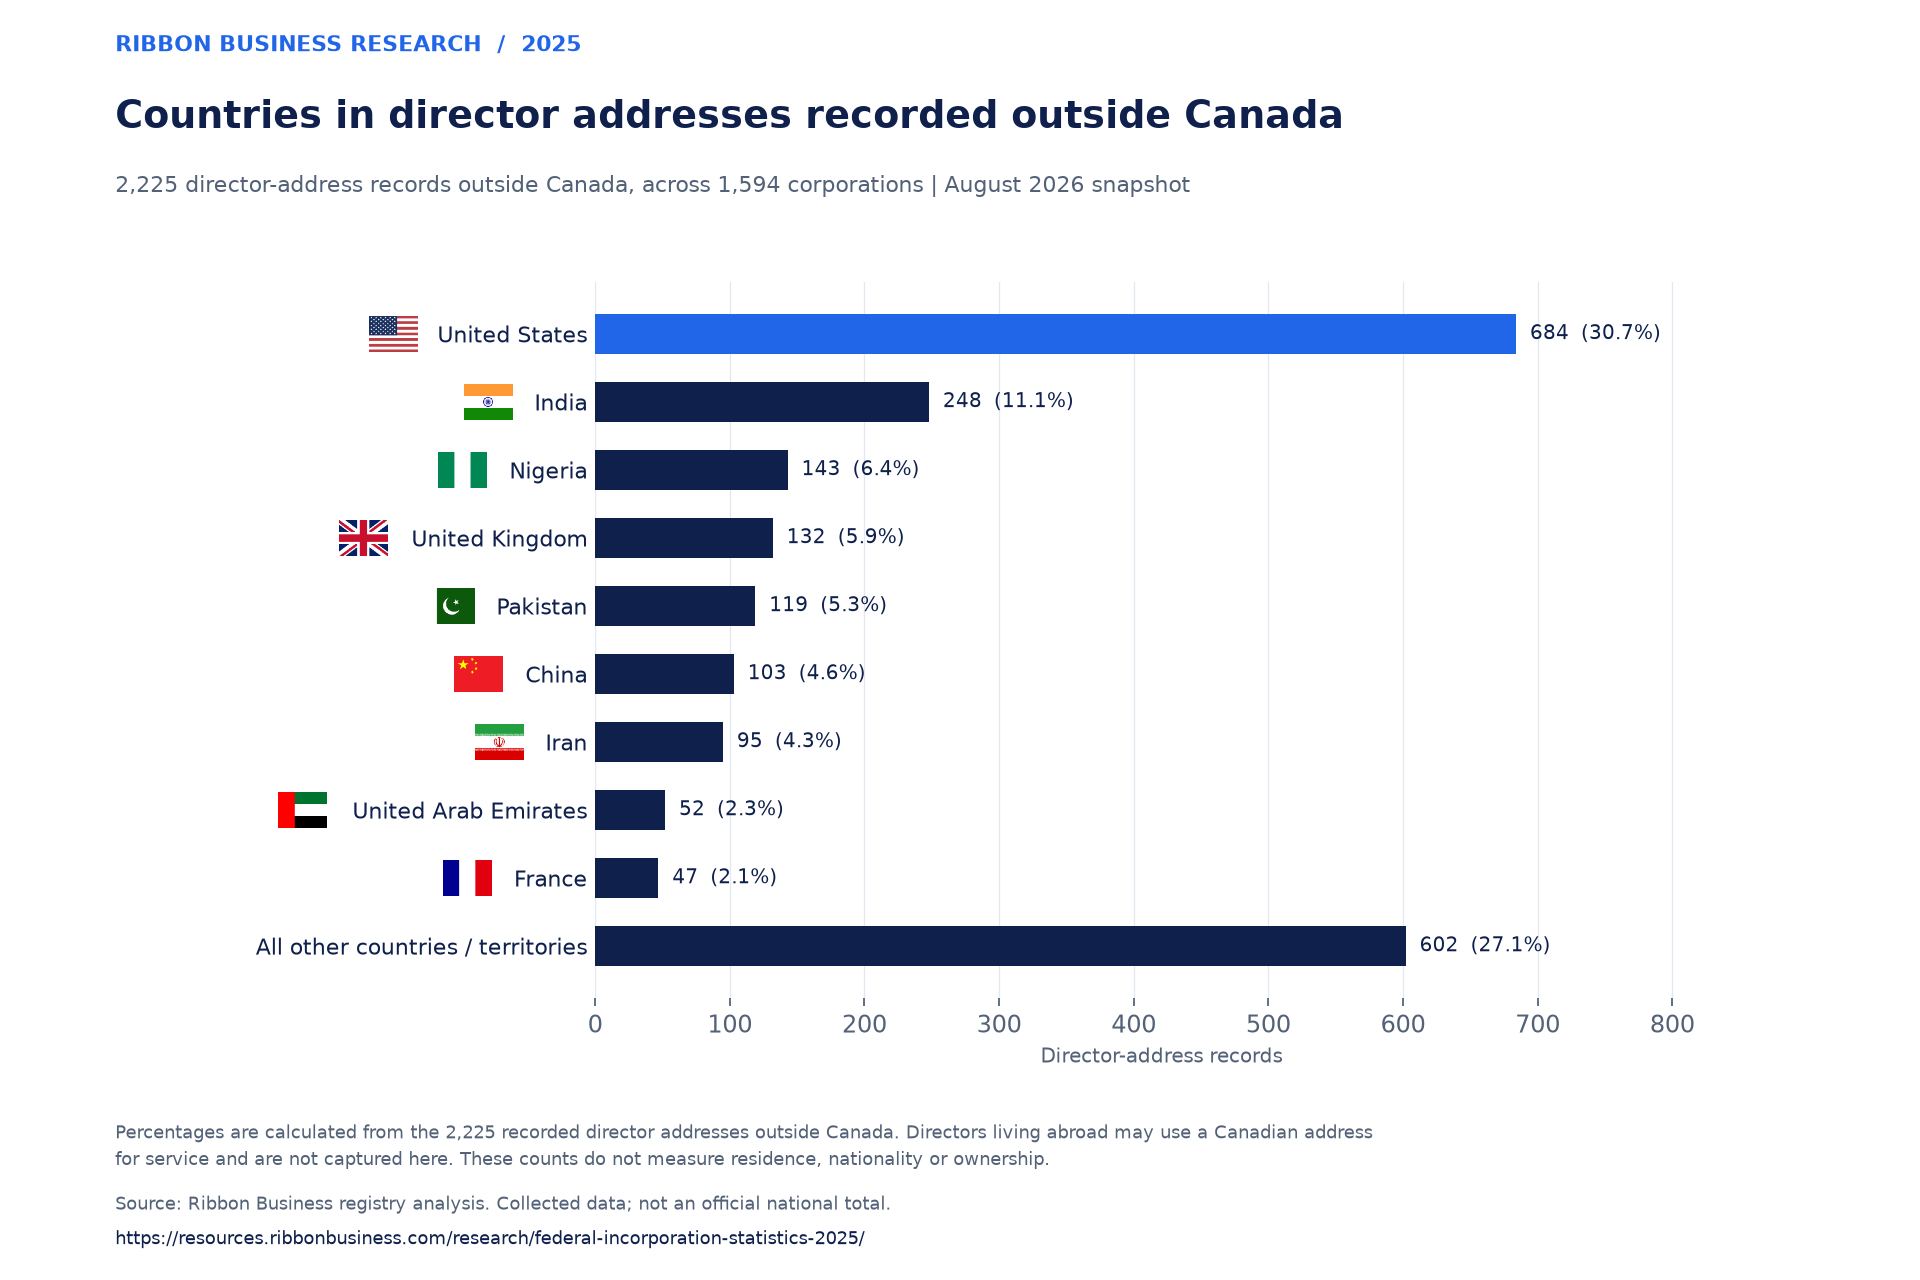
2,225 of 113,034 director-address records (1.97%) have a country outside Canada. These records appear across 1,594 corporations (1.87% of the dataset). One corporation can have several director-address records outside Canada, including addresses in different countries.
Corporations Canada permits a director to provide a residential address or a non-residential address for service. A director living outside Canada may therefore appear in the Canadian-address records when using a Canadian address for service. The 1.97% figure measures addresses outside Canada, not the proportion of directors who live abroad. This dataset cannot tell us how many additional directors live outside Canada.
Corporations Canada's director-address guidanceThe United States has the largest count, with 684 records, followed by India with 248 and Nigeria with 143. The chart shows the leading countries individually and groups the remaining countries and territories together.
2,225 director-address records outside Canada, across 1,594 corporations
 United States684 30.7%
 India248 11.1%
 Nigeria143 6.4%
 United Kingdom132 5.9%
 Pakistan119 5.3%
 China103 4.6%
 Iran95 4.3%
 United Arab Emirates52 2.3%
 France47 2.1%
Percentages are calculated from the 2,225 recorded director addresses outside Canada. Directors living abroad may use a Canadian address for service and are not captured here. These counts do not measure residence, nationality or ownership.
Source: Ribbon Business registry analysis · Collected August 2026
View data table: country or grouping
| Country or grouping | Director-address records | Percentage |
|---|---|---|
| United States | 684 | 30.7% |
| India | 248 | 11.1% |
| Nigeria | 143 | 6.4% |
| United Kingdom | 132 | 5.9% |
| Pakistan | 119 | 5.3% |
| China | 103 | 4.6% |
| Iran | 95 | 4.3% |
| United Arab Emirates | 52 | 2.3% |
| France | 47 | 2.1% |
| All other countries / territories | 602 | 27.1% |
The percentages in this chart use 2,225 director-address records outside Canada as the denominator. They are not shares of all corporations or all director records. A recorded address does not establish citizenship, ownership or legal residency status.
All 85,289 registered-office records in the dataset have Canada as their country. The country breakdown above concerns recorded director addresses, which are a different field. For practical planning, see our guide for non-resident founders.
Director and registered-office addresses often match
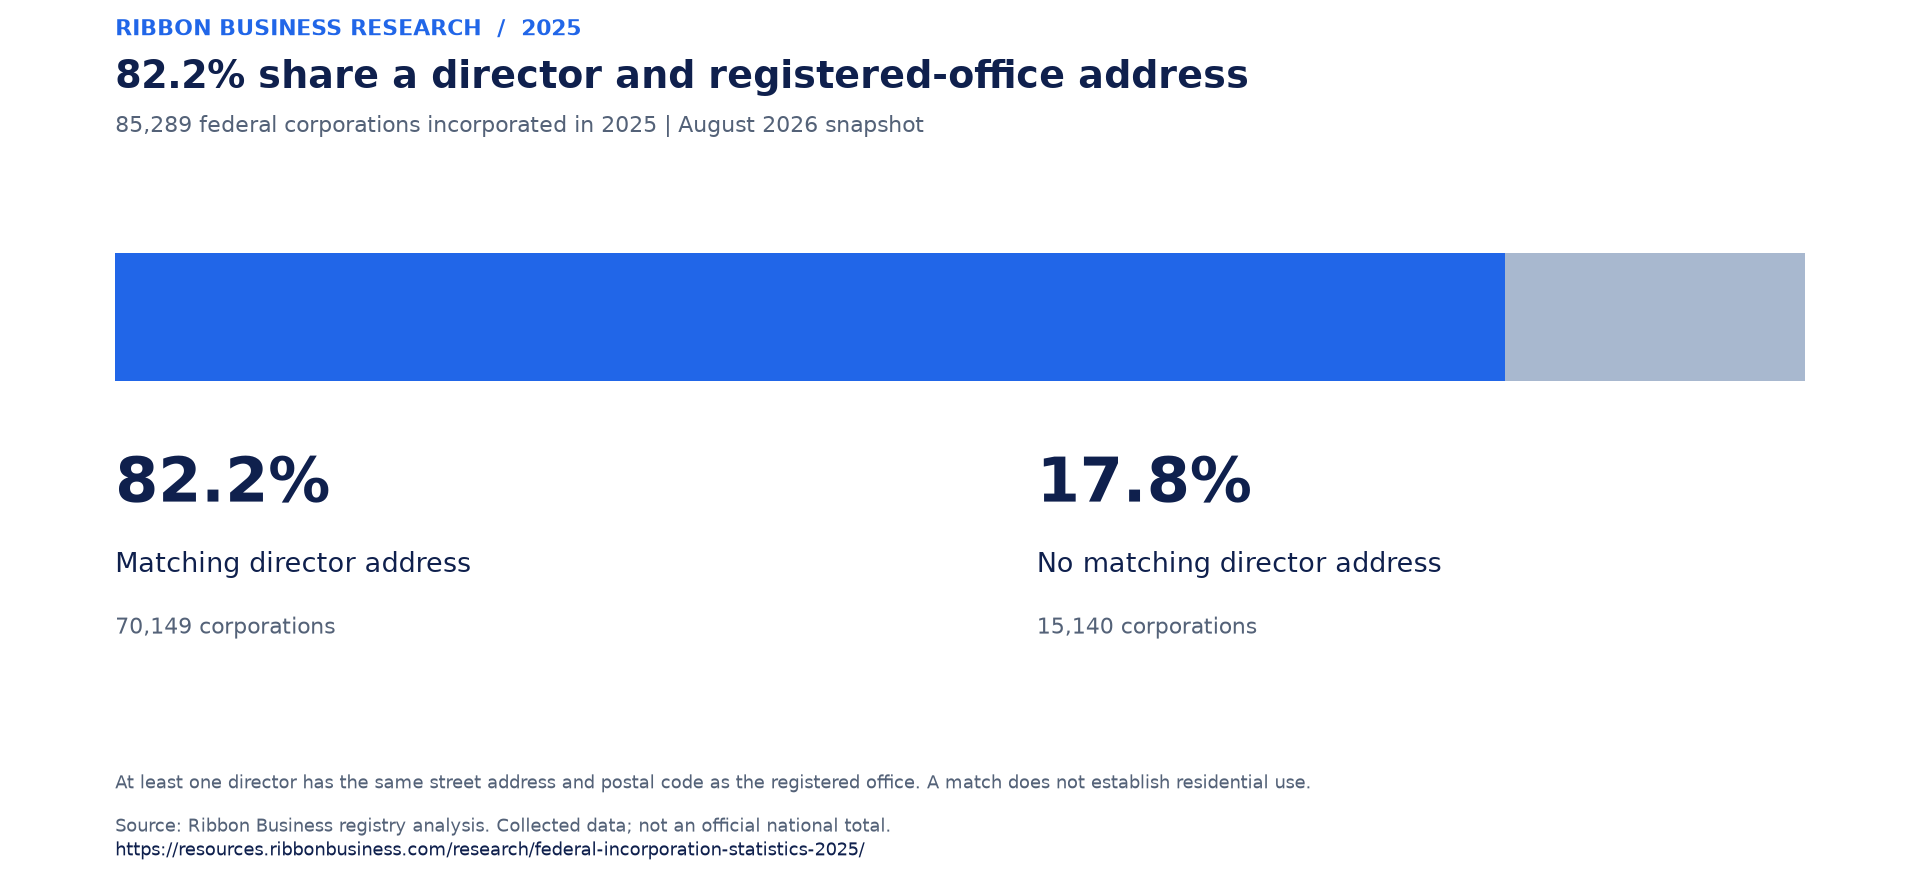
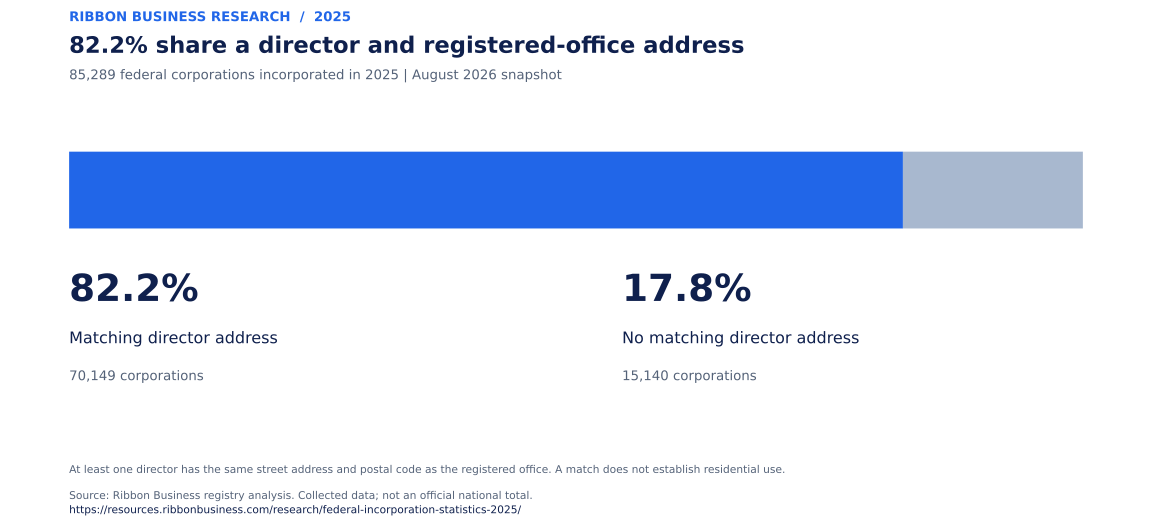
In 70,149 corporations (82.2%), at least one director's address matched the registered office on street address and postal code. The remaining 15,140 corporations (17.8%) did not have that match in the reported analysis.
2025 federal incorporation dataset · 85,289 corporations
At least one director has the same street address and postal code as the registered office. A match does not establish residential use.
Source: Ribbon Business registry analysis · Collected August 2026
View data table: address relationship
| Address relationship | Corporations | Percentage |
|---|---|---|
| Matching director address | 70,149 | 82.2% |
| No matching director address | 15,140 | 17.8% |
An address match is not evidence that the address is a home. A director can be listed at a residential address or another permitted address for service. The dataset does not classify buildings as residential or commercial, and it does not establish where a director lives or a business operates.
The practical point is that registered-office and director addresses are separate parts of the public record. Corporations Canada explains that both are public and that directors can provide a qualifying address for service. It also explains that historical filings remain available after information changes. See Corporations Canada's public-disclosure guidance.
Our business privacy guide explains the different records. If you are choosing an address, see using a home address for a corporation. If an existing address needs updating, use the registered-office change guide.
Numbered companies are common
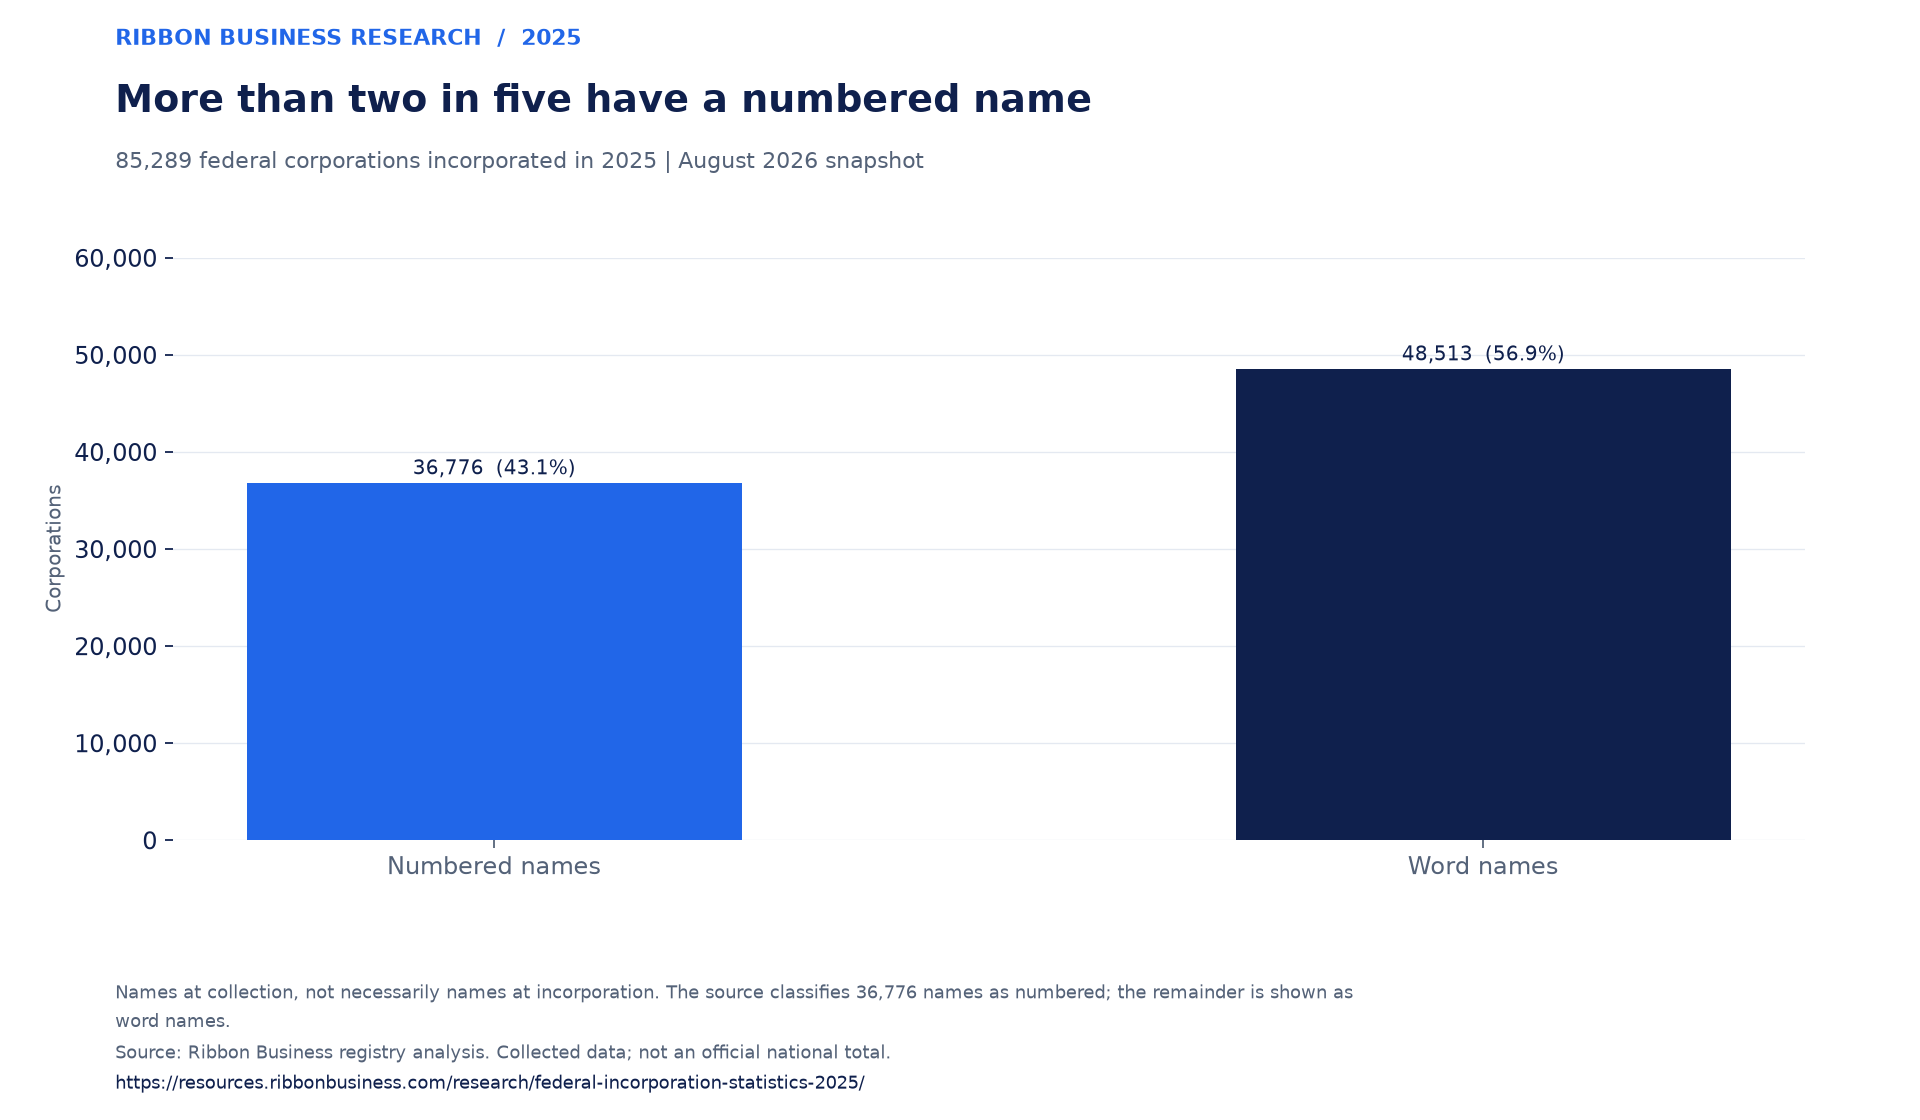
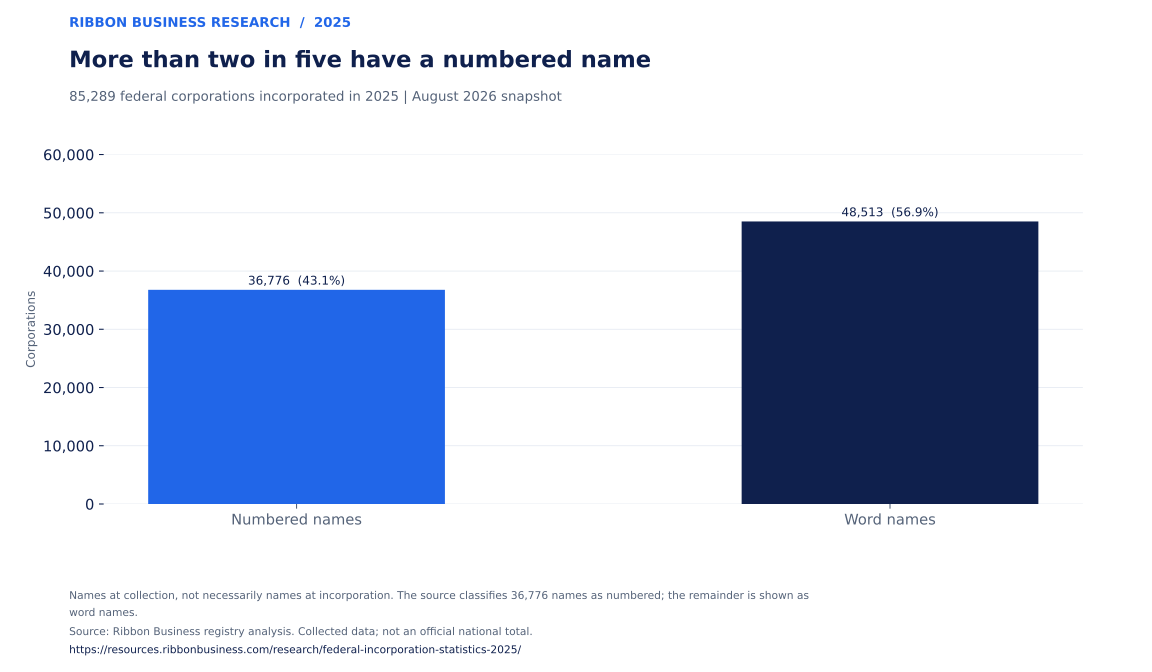
36,776 corporations (43.1%) had a numbered name in the collection snapshot. The other 48,513 (56.9%) had word names under the source report's classification.
2025 federal incorporation dataset · 85,289 corporations
Corporations by name classification · bars start at zero
Names at collection, not necessarily names at incorporation. The source classifies 36,776 names as numbered; the remainder is shown as word names.
Source: Ribbon Business registry analysis · Collected August 2026
View data table: name classification
| Name classification | Corporations | Percentage |
|---|---|---|
| Numbered names | 36,776 | 43.1% |
| Word names | 48,513 | 56.9% |
The result puts numbered companies in context: they account for more than two in five corporations in this federal dataset. It does not tell us why a numbered name was used, whether it was the original name, or whether the business uses a separate operating name.
Naming also limits what we can learn from the registry. A numbered name does not describe business activity, and words in a company name are not a reliable industry classification. We therefore do not use name keywords to estimate the size of sectors such as trucking, technology or construction.
For the practical choice between a numbered legal name, a word name and an operating name, see company names in Canada.
The most popular final legal identifier
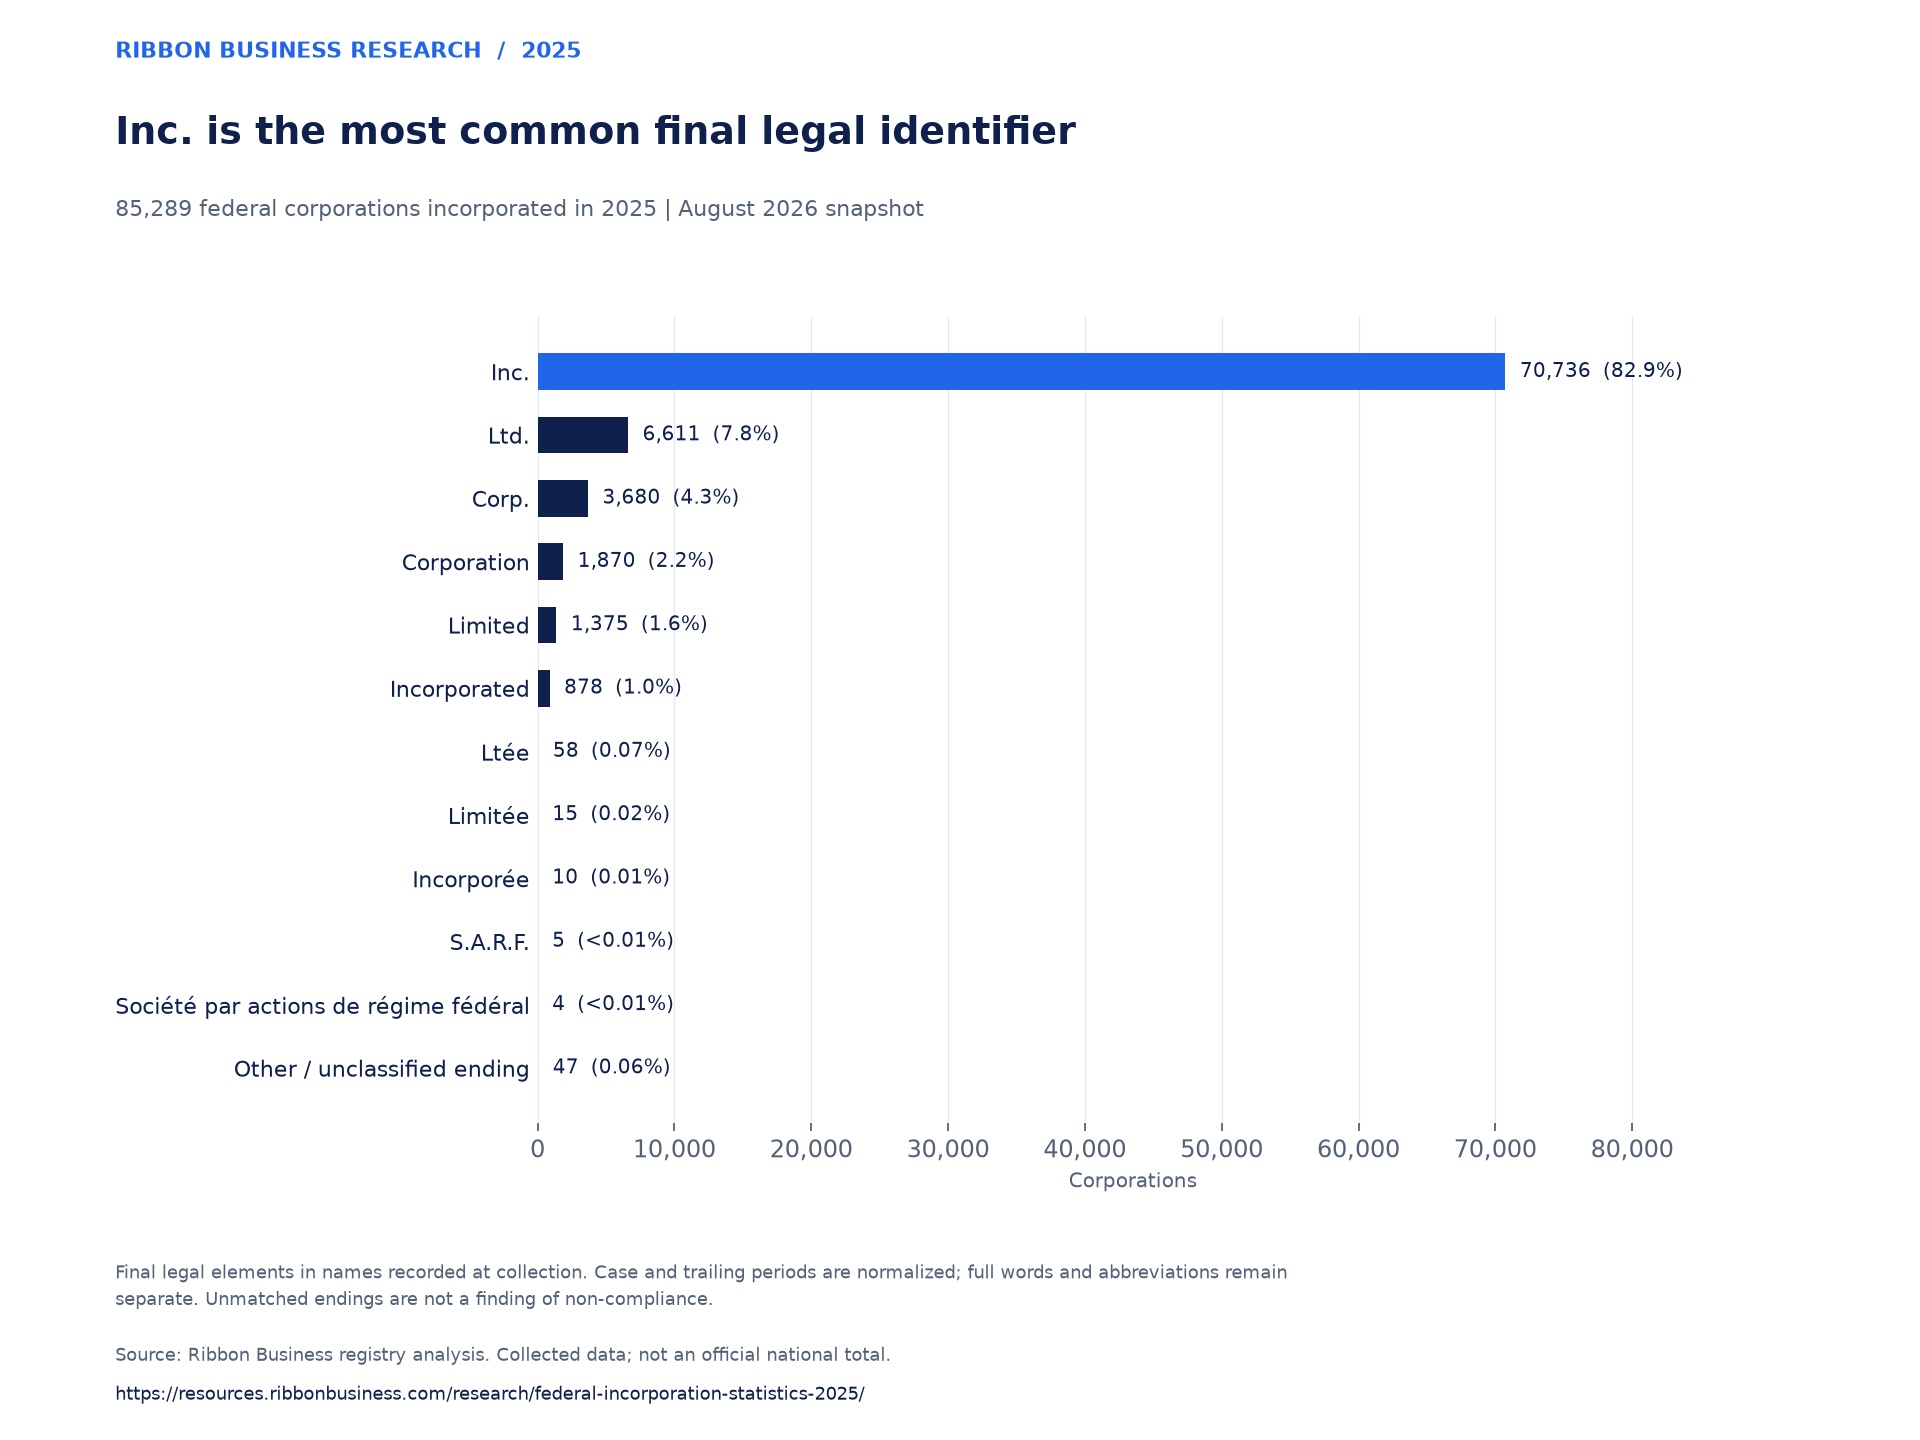
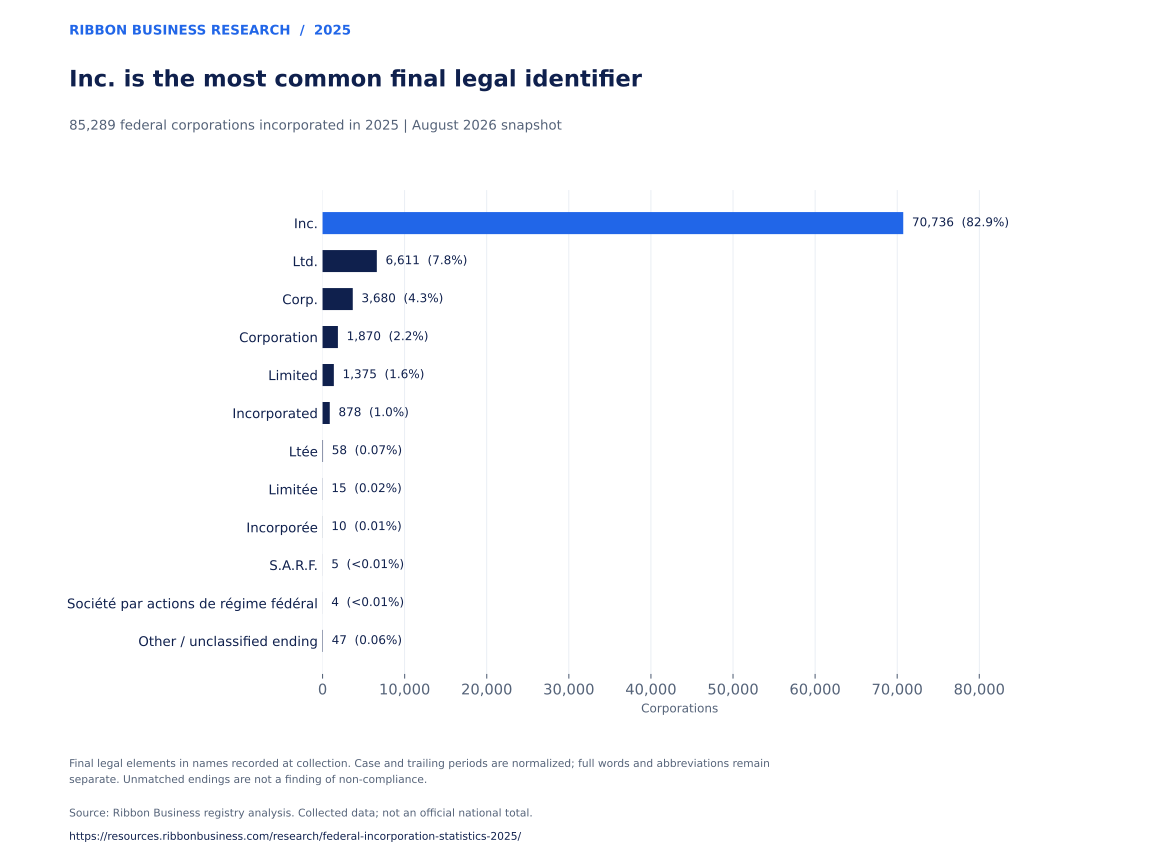
Inc. is the most common ending: 70,736 corporations (82.9%) have it as the final legal identifier in their recorded name. Ltd. follows with 6,611 (7.8%), then Corp. with 3,680 (4.3%). These counts cover the same federal corporations incorporated in 2025, with names recorded in August 2026.
2025 federal incorporation dataset · 85,289 corporations
Final legal elements in names recorded at collection. Case and trailing periods are normalized; full words and abbreviations remain separate. Unmatched endings are not a finding of non-compliance.
Source: Ribbon Business registry analysis · Collected August 2026
View data table: final legal identifier
| Final legal identifier | Corporations | Percentage |
|---|---|---|
| Inc. | 70,736 | 82.9% |
| Ltd. | 6,611 | 7.8% |
| Corp. | 3,680 | 4.3% |
| Corporation | 1,870 | 2.2% |
| Limited | 1,375 | 1.6% |
| Incorporated | 878 | 1.0% |
| Ltée | 58 | 0.07% |
| Limitée | 15 | 0.02% |
| Incorporée | 10 | 0.01% |
| S.A.R.F. | 5 | <0.01% |
| Société par actions de régime fédéral | 4 | <0.01% |
| Other / unclassified ending | 47 | 0.06% |
The chart keeps abbreviations and full words separate: “Inc.” and “Incorporated,” for example, are different recorded endings. It matches a legal element at the end of a name, ignoring capitalization, trailing periods and whitespace. It does not count a word simply because it appears elsewhere in the name.
47 names have another or unclassified ending under this rule. That category can include formatting or additional text after a legal element; it does not establish that a corporation lacks a valid legal name. The French expression “Société par actions de régime fédéral” is matched as a complete phrase.
Corporations Canada describes the permitted legal elements in its corporate naming requirements. The distribution shows which endings appear in these records, not whether one ending offers a business advantage.
Incorporation dates throughout 2025
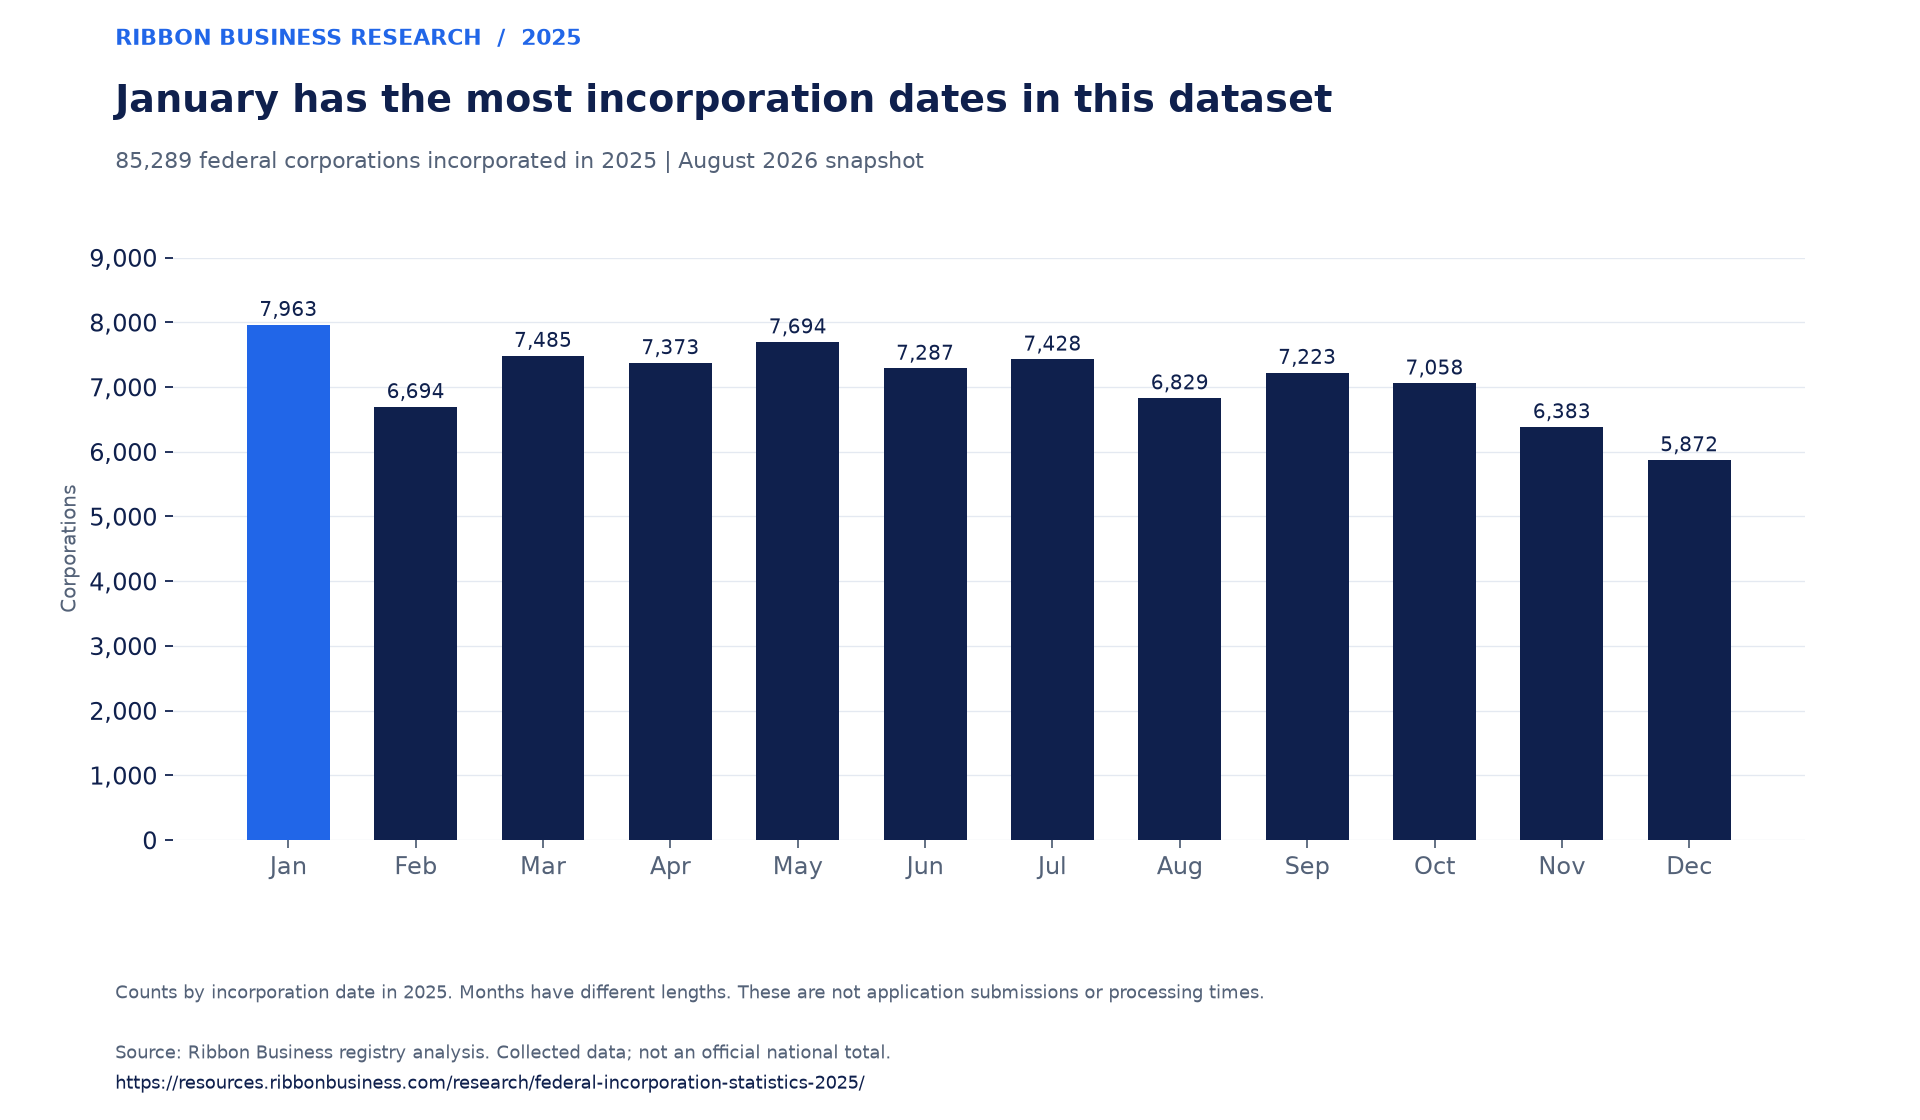
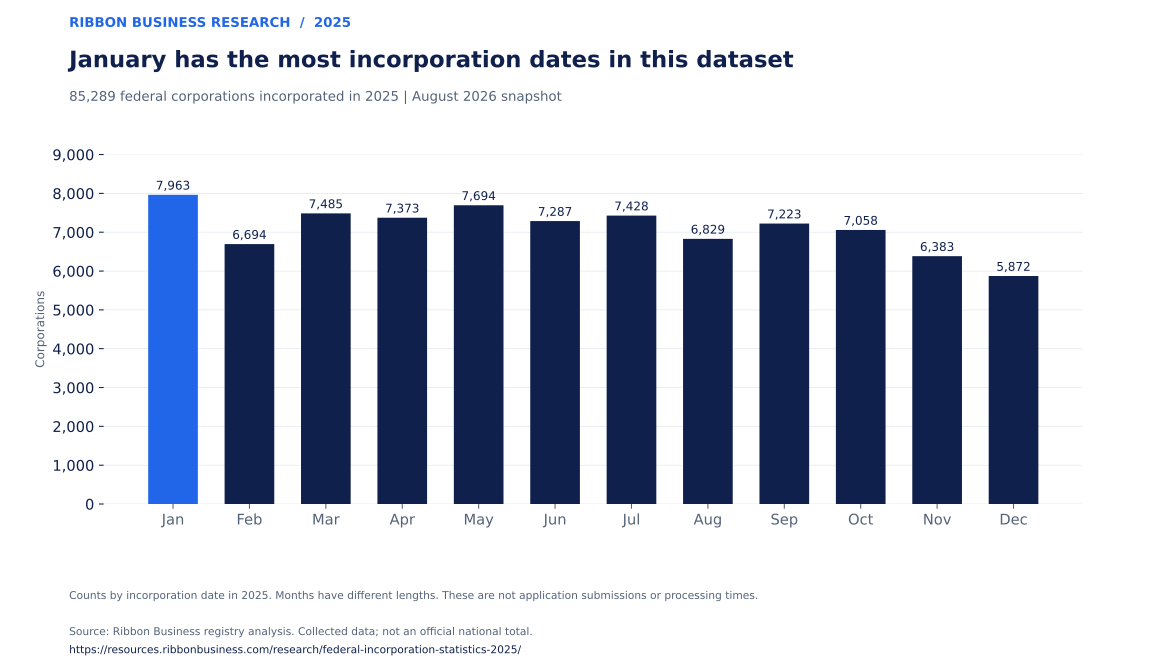
January accounted for 7,963 incorporation dates in the dataset, the highest monthly count. December had 5,872, the lowest. Both months have 31 days; December's count was approximately 26.3% lower than January's.
2025 federal incorporation dataset · 85,289 corporations
Swipe or scroll to see all 12 months.
Corporations by incorporation month · bars start at zero
Counts by incorporation date in 2025. Months have different lengths. These are not application submissions or processing times.
Source: Ribbon Business registry analysis · Collected August 2026
View data table: incorporation month
| Incorporation month | Corporations | Percentage |
|---|---|---|
| January | 7,963 | 9.3% |
| February | 6,694 | 7.8% |
| March | 7,485 | 8.8% |
| April | 7,373 | 8.6% |
| May | 7,694 | 9.0% |
| June | 7,287 | 8.5% |
| July | 7,428 | 8.7% |
| August | 6,829 | 8.0% |
| September | 7,223 | 8.5% |
| October | 7,058 | 8.3% |
| November | 6,383 | 7.5% |
| December | 5,872 | 6.9% |
These are dates recorded for incorporation. They are not timestamps showing when applications were submitted or processed. Monthly totals also cover different numbers of days, and one year of data cannot establish a recurring seasonal pattern. The chart should not be used to choose a faster or more advantageous time to incorporate.
The most popular day of the week to incorporate
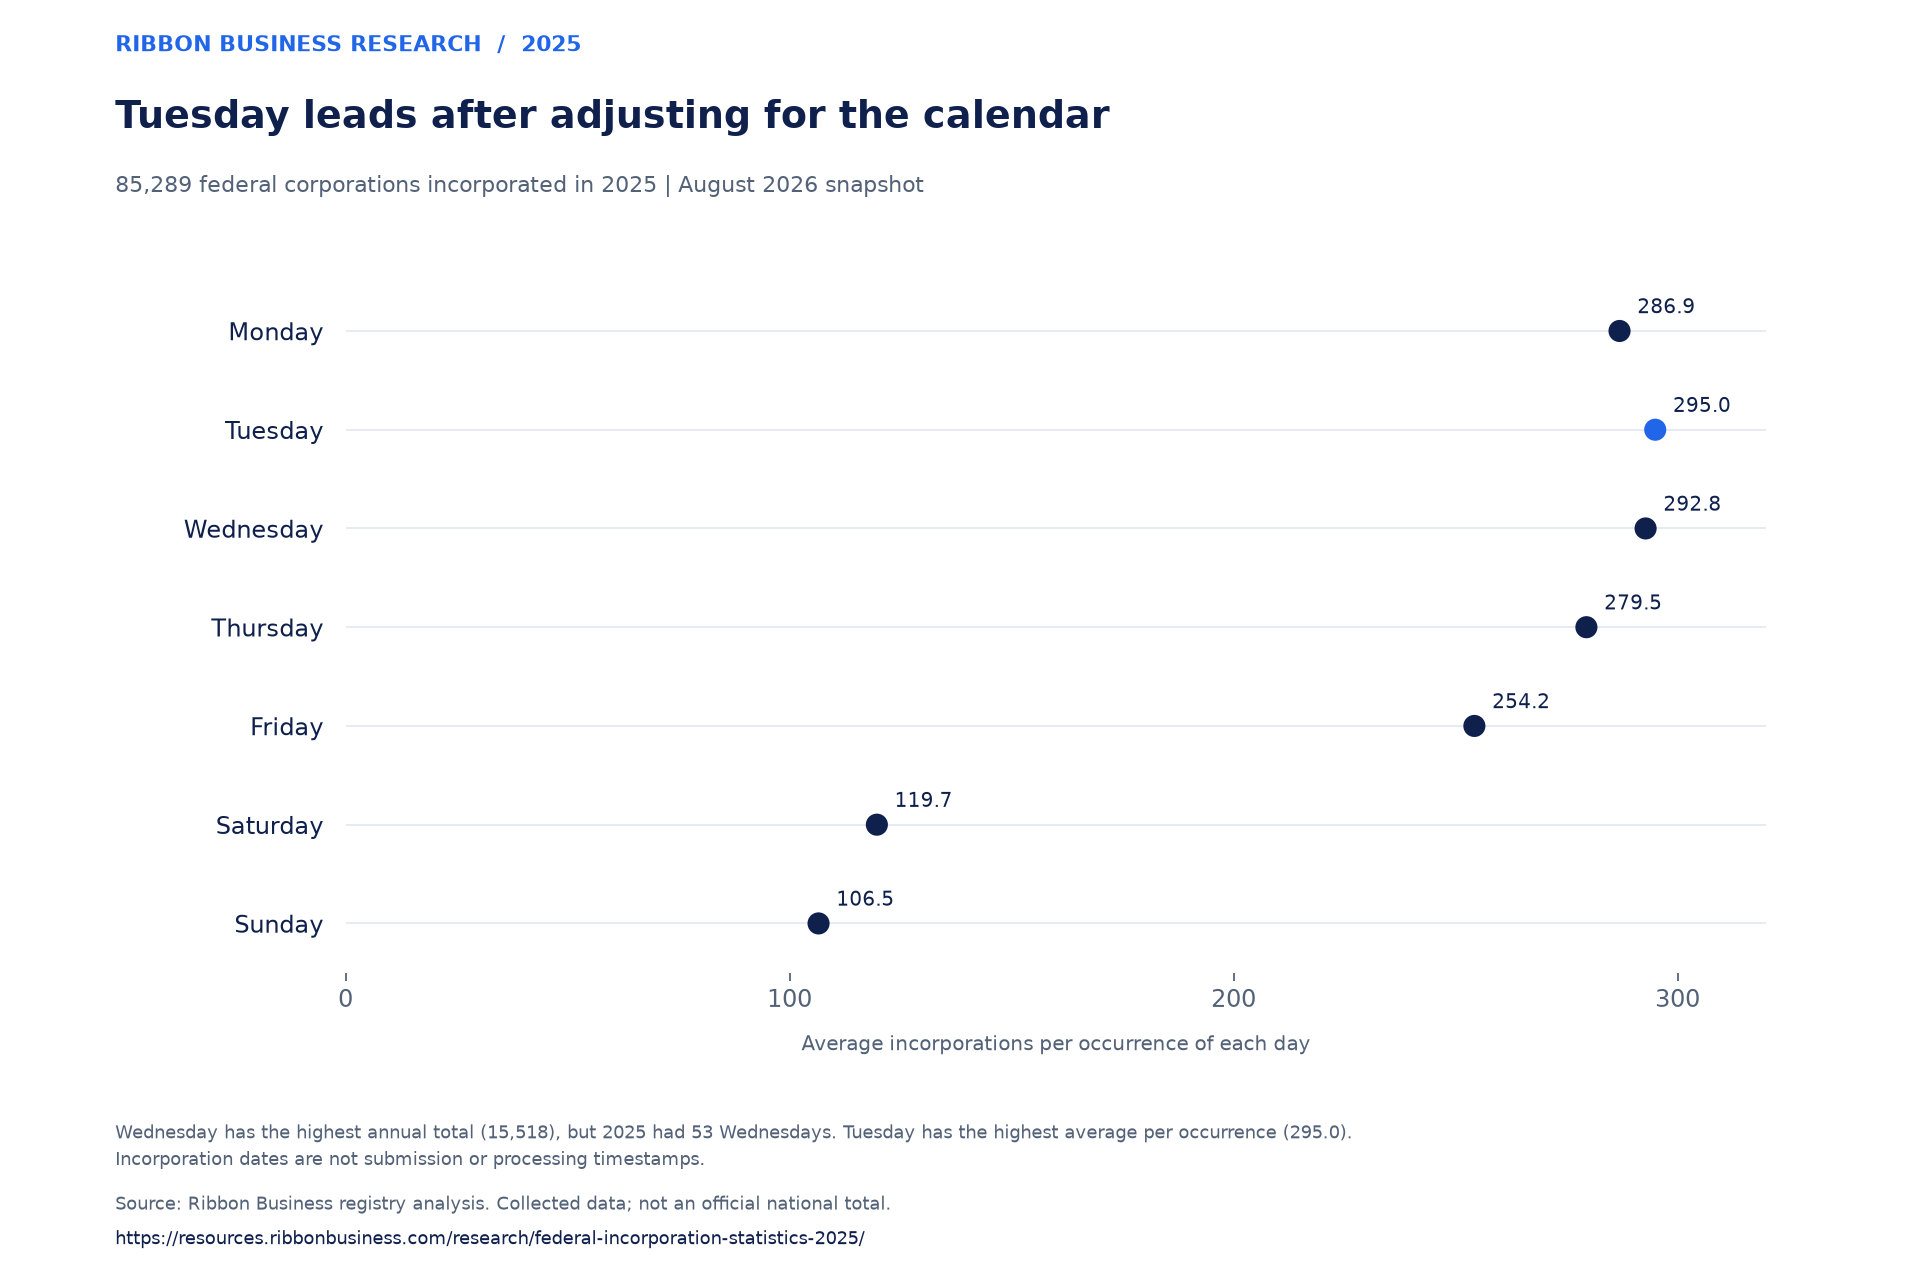
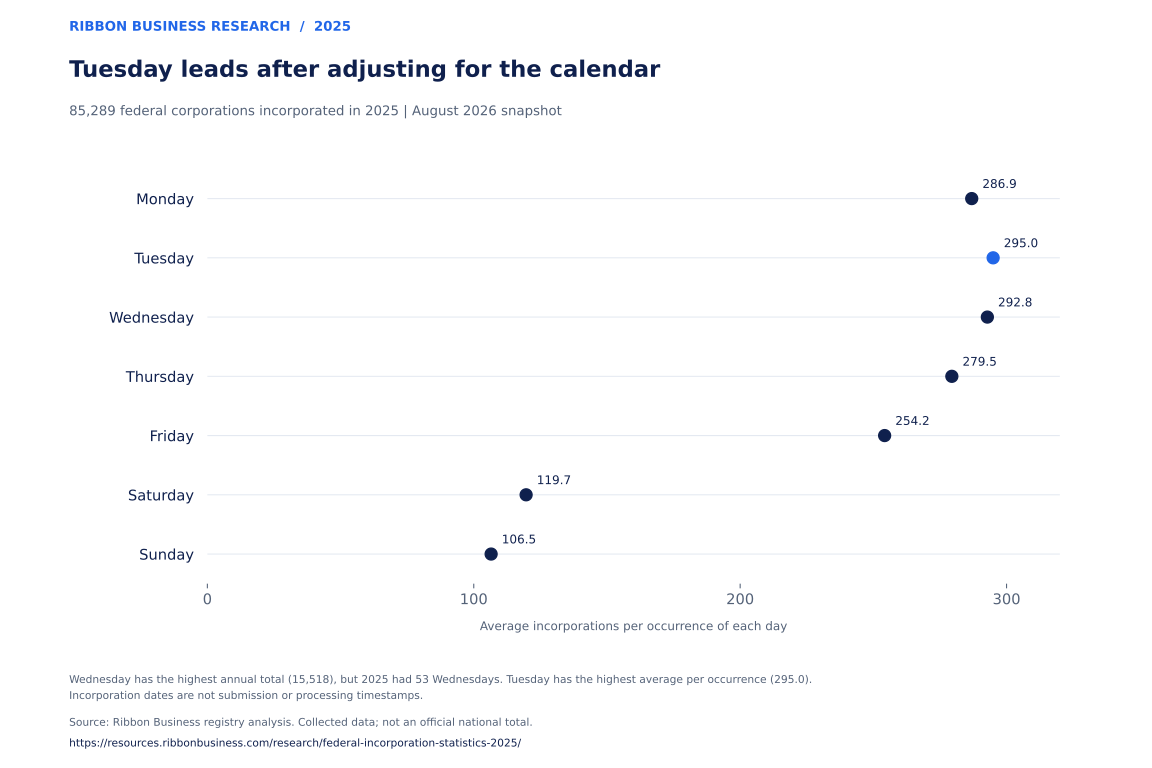
Wednesday has the highest annual total: 15,518 incorporations (18.2%). But 2025 had 53 Wednesdays and only 52 of each other weekday. After adjusting for those extra occurrences, Tuesday leads with an average of 295.0 incorporations per Tuesday, compared with 292.8 per Wednesday.
2025 federal incorporation dataset · 85,289 corporations
Average incorporations per occurrence of each day
Wednesday has the highest annual total (15,518), but 2025 had 53 Wednesdays. Tuesday has the highest average per occurrence (295.0). Incorporation dates are not submission or processing timestamps.
Source: Ribbon Business registry analysis · Collected August 2026
View data table: day of the week
| Day of the week | Corporations | Percentage | Occurrences in 2025 | Average per occurrence |
|---|---|---|---|---|
| Monday | 14,920 | 17.5% | 52 | 286.9 |
| Tuesday | 15,338 | 18.0% | 52 | 295.0 |
| Wednesday | 15,518 | 18.2% | 53 | 292.8 |
| Thursday | 14,532 | 17.0% | 52 | 279.5 |
| Friday | 13,220 | 15.5% | 52 | 254.2 |
| Saturday | 6,222 | 7.3% | 52 | 119.7 |
| Sunday | 5,539 | 6.5% | 52 | 106.5 |
The dots compare the average number per occurrence of each day. Open the data table for the raw totals, percentage of the dataset and number of occurrences. Saturday and Sunday together account for 11,761 incorporation dates (13.8%).
This describes which dates appear in the registry. It does not measure when people completed applications, whether filings were processed on weekends, or which day provides faster service.
How we conducted the research
Source and population
This page presents aggregate findings from Ribbon Business's Federal Incorporation Statistics, Calendar Year 2025, prepared September 21, 2026. The findings are based on collected federal corporation registry data.
The dataset contains 85,289 CBCA corporations with incorporation dates in calendar 2025. Each corporation has one registered-office record. Data was collected on August 14, 2026, and the aggregate findings were checked against the original records for this edition.
Coverage and exclusions
The report describes the corporations in the collected dataset. It is not an official total of every federal or Canadian incorporation in 2025, and completeness against an official annual register has not been established.
Provincial incorporations, unincorporated businesses and corporations governed by other federal statutes are outside this study. The figures are counts of the collected records, not estimates of the wider business population.
Dates and geographic definitions
Incorporation dates describe events in 2025. Addresses, names and directors describe the later collection snapshot and may have changed since incorporation. Location means the registered office, which need not be the business's operating address or a founder's home.
City labels are used as reported. In the companion Brampton article, Toronto combines Toronto, Scarborough, North York, Etobicoke, York and East York. We have not applied a national municipal-boundary or metropolitan-area crosswalk. No population-adjusted rates are presented.
Address matching and classification
The source describes address-string grouping with case and whitespace normalization. The director-address comparison uses matching street-address and postal-code fields. Spelling differences, unit formatting and other variations can separate records that refer to the same physical location. The distinct-address counts should therefore be read as string groups, not a verified inventory of buildings.
The numbered-name count is reproduced by selecting names beginning with a digit, matching the source report's total. This is a name-string classification, not a legal-name or industry classifier.
Checks and limits of this edition
Province, board-size, month, weekday, address-match, name-type and legal-ending distributions each reconcile to 85,289 corporations. The director-country chart instead reconciles to 2,225 director-address records outside Canada, drawn from 113,034 director records. The country field is used as stored. It may describe an address for service rather than a residential address; it does not measure where directors live or their citizenship or statutory residency.
Weekday averages divide each day's incorporation count by its number of occurrences in calendar 2025. The director distribution includes two corporations with 14 directors and one with 15, resolving the three-corporation gap in the initial report. These counts were reproduced from the original database; this is an internal verification, not an independent external audit.
The downloads reproduce the charts and include the denominator for each table. They do not include individual director records. Dissolution comparisons are omitted because corporations incorporated earlier in 2025 had more time to change status before collection.
Small province and territory flags are sourced from Canadian Heritage's provincial and territorial symbols collection.
Download and cite the research
Each chart includes a data table and downloads in CSV, PNG and SVG formats. Images include Ribbon Business attribution and the report address. The downloadable files contain aggregate counts, not individual director records.
Suggested citation
Ribbon Business. 2025 Federal Incorporation Statistics: An Analysis of 85,289 Corporations. September 2026. Registry snapshot: August 2026. https://resources.ribbonbusiness.com/research/federal-incorporation-statistics-2025/
When citing a finding, retain the federal-only scope, dataset denominator and collection date. Link to the relevant section so readers can inspect its qualifications.
Author and research context
Nicholas Wesley James is co-founder of Ribbon Business. Ribbon provides incorporation, corporate compliance and business-address services, which are relevant commercial interests when interpreting this report. The companion city study explains our connection to the local business community.
For questions or corrections, contact Nicholas through his author profile and identify the table or finding concerned.
Edition notes
September 22, 2026: Prepared from the September 21 source analysis, then checked the original database and collection records. Restored the three omitted corporations with 14 or 15 directors, corrected the maximum board size from 12 to 15, and identified York and East York in the Toronto aggregation. Moved the detailed Brampton analysis into a companion article and added director-country and weekday breakdowns. Clarified that recorded director addresses can be addresses for service and do not measure residence. Added a breakdown of final legal identifiers using end-of-name matches. Future corrections will be recorded here.